The AI Execution Gap: From Ambition to Impact
The TTA AI Maturity Report 2026: 75 organisations, 9 countries, one consistent finding. The barrier to scaling AI is rarely the technology.
AI ambition is no longer the problem. Execution is. Investment in artificial intelligence is accelerating at unprecedented levels, yet it is not consistently translating into sustained business value. Initiatives stall beyond isolated use cases, and the distance between AI ambition and AI impact keeps widening.
Over eight months, The Transformation Alliance (TTA), the international consulting alliance of which H&Z is a member, assessed 75 organisations across 9 countries and 6 industries against an eight-pillar AI Maturity Framework. The finding is as consistent as it is uncomfortable: the barrier to scale is rarely the technology.
The strongest organisations are not those with the most pilots. They are the ones that support their AI activities with the right operating models, workforce enablement, and measurable value tracking. This page gives you the key results. The full report, including the complete framework and the AI Maturity Toolkit, is available for download below.
99% are investing. 1% call themselves mature.
Nearly every organisation is experimenting with AI, and adoption is more widespread than ever. Yet in a recent global survey, only 1% of organisations describe their AI capabilities as mature. The overwhelming majority remain early stage, experimental, or still developing.
This disconnect between adoption and maturity was the catalyst for the TTA research: 75 structured interviews with CEOs, CIOs, CTOs, Heads of Data & AI, and transformation leaders, conducted between July 2025 and February 2026.
Each square represents 1% of organisations. The pink square: those that call themselves mature in AI.
EIGHT CAPABILITIES, ONE CONSISTENT GAP
Average maturity scores across all 75 organisations cluster in a narrow band between 2.4 and 2.7 out of 5. The two weakest pillars are both about how organisations embed AI, not which tools they buy.
Average maturity scores per pillar across all interviews. Scale: 1 (Ad Hoc) to 5 (Optimised). Source: TTA AI Maturity Report 2026, n=75.
WHERE AI EXECUTION BREAKS DOWN
Across the organisations studied, three constraints emerged consistently as the primary barriers to scale. None of them is a technology problem.
Disconnected operating models
Successful pilots are rarely designed with scale in mind. AI capability stays concentrated in isolated teams, creating dependency bottlenecks. Without clear ownership, use cases remain fragmented.
Limited workforce adoption
Employees are not sufficiently equipped, incentivised, or supported to integrate AI into their day-to-day work. Tools remain underutilised, and productivity gains are left on the table.
Absence of value tracking
Few organisations reliably measure the impact of the initiatives they launch. Without pre-defined success metrics, it is hard to prioritise investment or demonstrate ROI.
Deep dives into all eight pillars, benchmarks by industry and country, and the six-step AI Maturity Toolkit. Free of charge.
THE EIGHT PILLARS OF AI MATURITY
The TTA AI Maturity Framework examines how effectively organisations integrate AI into the core mechanics of how they operate and create value. Eight pillars, grouped into four dimensions, each scored on five levels from Ad Hoc to Optimised.
1. Strategy & Leadership
Clarity of AI ambition, executive sponsorship, and the link between AI and business priorities.
2. AI Initiatives & Business Impact
How effectively use cases are identified, prioritised, scaled, and measured for tangible value.
3. Data Management & Infrastructure
Quality, accessibility, and ownership of data, plus the platforms that support AI reliably.
4. Tools & Technology
Maturity of the AI tooling ecosystem: platforms, integration, scalability, and vendor approach.
5. People & Skills
Workforce capability to use AI effectively, from leadership literacy to role-based enablement.
6. Operating Model & Processes
How AI is structured, prioritised, and embedded in operations, from idea to deployment.
7. Change Management
The ability to drive adoption, reshape behaviours, and embed AI into day-to-day ways of working.
8. Governance & Ethics
Policies, controls, accountability, and risk management that let AI scale responsibly.
FIVE LEVELS, FROM AD HOC TO OPTIMISED
Every pillar is scored on the same five-level scale, from isolated experiments to embedded, enterprise-wide capability.
Ad Hoc
Isolated experiments, no articulated vision, benefits assumed rather than measured.
Localised
Pilots deliver local wins, but ownership, standards, and measurement stay inconsistent.
Integrated
Board-approved roadmap, shared standards, and repeatable delivery across business areas.
Scaled
AI is a core strategic lever with enterprise platforms, value dashboards, and embedded change.
Optimised
AI shapes strategy and market positioning, with continuous optimisation loops across workflows.
Where the market stands: with a cross-pillar average of 2.62, most organisations sit between Localised and Integrated. The pink markers show where two thirds of organisations scored in Change Management: Level 2 or below.
THE FINDINGS BEHIND THE GAP
Ambition scores highest, execution scores lowest. The two capabilities most critical to embedding AI in day-to-day operations are exactly where organisations are weakest.
Change Management: the main barrier to scale
The lowest scoring pillar in the entire study. Around two thirds of organisations sit at Level 2 or below: plenty of early enthusiasm and lunch-and-learn sessions, very little structured rollout. Leading organisations treat adoption as a coordinated transformation with clear ownership, consistent leadership messaging, and adoption metrics that act as early warning signals.
Operating Model & Processes: a consistent blocker
More than half of the organisations operate at Level 1 or 2. Interviewees described uncertainty around ownership, prioritisation, and decision rights, with promising use cases emerging in isolation and no delivery mechanism to repeat them. Leading organisations balance central coordination of platforms, governance, and expertise with business unit ownership of demand and adoption.
People & Skills
One of the highest scores, but capability is concentrated in small specialist teams. The task is diffusing it across the business, not hiring more experts.
AI Initiatives & Impact
Nearly every organisation can point to pilots. Far fewer have funding models, ownership structures, or value tracking to turn them into impact.
Governance & Ethics
Catching up with AI innovation, driven strongly by the EU AI Act. In mature organisations, governance accelerates adoption instead of slowing it.
Data, Tools & Technology
Data maturity multiplies or limits every other pillar. Tool sprawl and legacy systems remain the most common sources of friction.
AI MATURITY IS NOT EVENLY DISTRIBUTED
Sector averages cluster between 2.4 and 2.7, but the individual pillars show more variation in their capability gaps. The Media, Information & Technology sector scores above cross-industry averages in all areas. Industrial, Manufacturing & Logistics scores below the average in every single one.
| Industry | Strategy | AI Impact | Data | Tools & Tech | People & Skills | Op Model | Change Mgmt | Governance |
|---|---|---|---|---|---|---|---|---|
| Media, Information & Technology | 3.6 | 3.1 | 2.9 | 3.3 | 3.3 | 3.3 | 2.9 | 3.3 |
| Public Sector & Healthcare | 2.5 | 2.3 | 3.4 | 2.8 | 3.3 | 2.7 | 3.2 | 3.2 |
| Financial Services | 2.6 | 2.5 | 2.9 | 2.8 | 3.0 | 2.4 | 2.0 | 3.3 |
| Consumer & FMCG | 1.8 | 2.0 | 3.0 | 2.0 | 2.4 | 2.2 | 2.0 | 2.8 |
| Industrial, Manufacturing & Logistics | 2.5 | 2.3 | 2.5 | 2.4 | 2.2 | 1.9 | 2.1 | 2.4 |
| Energy & Infrastructure | 2.6 | 2.6 | 2.3 | 2.1 | 2.4 | 2.4 | 2.2 | 1.8 |
Average AI maturity scores per pillar and industry. Source: TTA AI Maturity Report 2026, n=75. Smaller samples (Consumer & FMCG, Public Sector & Healthcare) should be read directionally.
Media, Information & Technology
The front-runner. AI is tied to commercial success and product decisions. Even here, scaling beyond early-adopter teams stays hard.
Public Sector & Healthcare
Strong foundations in data, skills, and governance. Readiness has not yet translated into consistently scaled outcomes.
Financial Services
Governance-led and comparatively mature on controls. The risk: caution becomes a ceiling on value creation.
Consumer & FMCG
Strong customer data environments and responsible AI controls, while enterprise-wide execution and upskilling lag behind.
Industrial, Manufacturing & Logistics
No shortage of use cases, from supplier scouting to document processing. The gap is execution discipline, not ideas.
Energy & Infrastructure
Credible operational use cases meet weak enabling conditions. Governance scored 1.8, the lowest of any sector.
HOW MATURITY DIFFERS ACROSS MARKETS
Geography alone does not determine maturity. Different countries are advancing through different pathways.
Sweden
The strongest and most balanced profile: strategic intent, workforce readiness, and mature governance combined.
Italy
The most polarised: strong data, tools, and governance, materially weaker operating model and change capability.
Germany
Balanced mid-range results with broad-based progress and no severe weaknesses.
United Kingdom
Steady maturity development across multiple organisational dimensions, similar to Germany.
France
Lower averages across several pillars, particularly People & Skills and Governance & Ethics.
Directional indicators based on participating organisations. Interviews were also conducted in Switzerland, the United States, the United Arab Emirates, and Saudi Arabia.
FROM INSIGHT TO ACTION: THE AI MATURITY TOOLKIT
The report closes with a six-step toolkit that turns the framework into a working instrument. It is designed to be iterative: as the AI landscape evolves, organisations revisit the toolkit to track progress and adapt their approach.
Assess
Score your organisation across all eight pillars of the framework.
Benchmark
Compare your position against 75 peers, by industry and geography.
Identify gaps
Pinpoint the capability gaps that limit progress the most.
Get recommendations
Receive practical actions aligned with your current maturity level.
Prioritise & sequence
Order transformation efforts by impact and readiness.
Track & revisit
Measure progress over time and adapt as the market matures.
What's inside?
-
The complete eight-pillar AI Maturity Framework with descriptions of all five maturity levels
-
Cross-industry benchmark scores from 75 organisations in 9 countries
-
Detailed profiles of all six industry groups, from Media to Energy
-
What leading organisations do differently, in their own words
-
Country observations for Germany, the UK, France, Italy, and Sweden
-
The six-step AI Maturity Toolkit to close your organisation’s AI execution gap
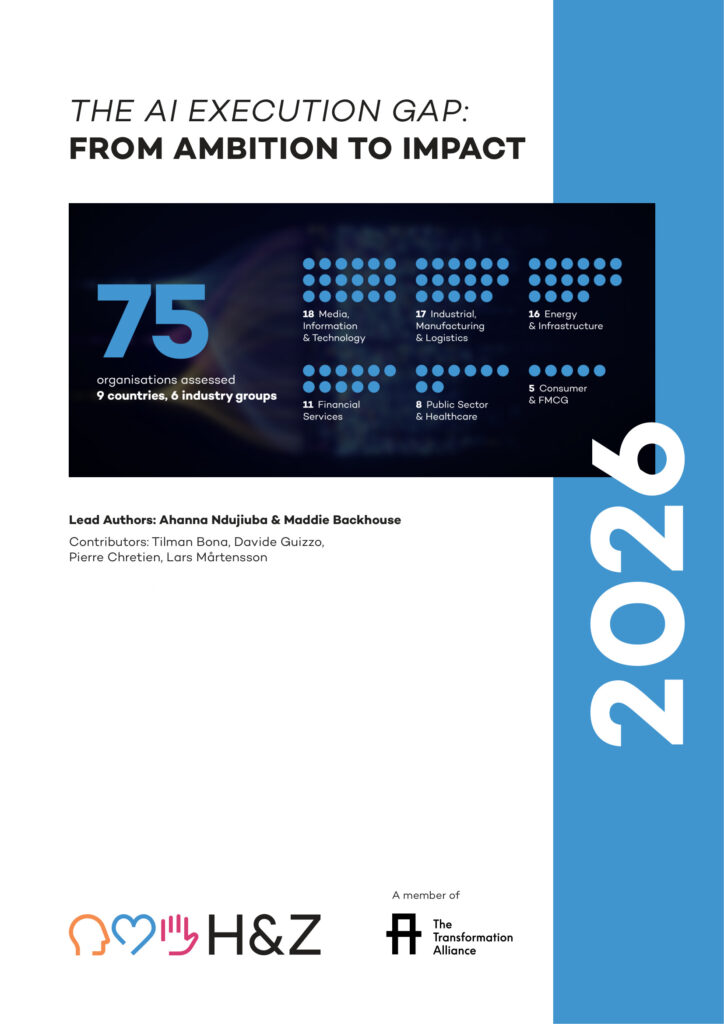
DOWNLOAD THE REPORT
Get the full analysis: deep dives into all eight pillars of AI maturity, benchmarks by industry and country, and the six-step AI Maturity Toolkit. Free of charge.
TAKE THE STUDY FURTHER
The report is one part of a wider body of work. Explore the interactive dataset behind it, and the alliance of five European consultancies that produced it.
The AI Maturity Dashboard
The interactive companion to the report. Filter maturity scores by industry and by pillar, follow the correlations between capabilities, and benchmark your own organisation against the same five-level scale.
The Transformation Alliance
The study was run by TTA, a network of five independent consultancies with 19 offices across Europe and more than 1,500 consultants. H&Z is a member of the alliance and one of the firms interpreting what the findings mean for European businesses.
FREQUENTLY ASKED QUESTIONS
What is AI maturity?
AI maturity describes how effectively an organisation translates AI investment into sustained business value at scale. It spans eight pillars: strategy, AI initiatives, data, tools, people, operating model, change management, and governance. Maturity is systemic: progress in one pillar rarely compensates for weakness in another.
What is the AI execution gap?
The AI execution gap is the distance between AI ambition and realised impact. In the TTA study, Strategy & Leadership scored highest of all eight capabilities (2.7 of 5), while the two execution capabilities, Change Management (2.4) and Operating Model & Processes (2.5), scored lowest. Organisations are adopting AI faster than they are redesigning the structures required to scale it.
How was AI maturity measured in this report?
The Transformation Alliance assessed 75 organisations across 9 countries and 6 industry groups between July 2025 and February 2026. Senior leaders, including CEOs, CIOs, CTOs, and Heads of Data & AI, were interviewed and scored against an eight-pillar framework on a five-level scale from Ad Hoc to Optimised.
Which industries lead in AI maturity?
Media, Information & Technology leads, scoring above the cross-industry average in every pillar. Financial Services is comparatively mature in governance and controls. Industrial, Manufacturing & Logistics and Energy & Infrastructure trail behind, held back by ageing systems, fragmented data, and weak change capability rather than a lack of use cases.
Who is behind the report?
The report was produced by The Transformation Alliance (TTA), an international alliance of consulting firms of which H&Z Management Consulting is a member. The research builds on more than 40 AI client use cases delivered across the alliance and 75 structured maturity assessments.