Haselhorst Smart City Ranking 2026
Since 2018, we have been monitoring the transformation of all German cities with a population above 30,000. The Haselhorst Smart City Ranking provides insights into the achievements, strengths, and challenges of more than 400 cities, drawing on publicly available information and qualitative research.

A TOOL FOR CITIES AND UTILITIES
Cities and utility companies face the same challenge: they must successfully navigate their transformation whilst facing high investment pressures, growing expectations, and limited resources.
The Haselhorst Smart City Ranking provides cities with transparency regarding their current stage of transformation. It enables cities to compare themselves with other communities and helps to identify priorities for future development. The ranking provides a sound basis for structuring investment decisions and for communicating the best way forward clearly and effectively to politicians, administrators, and funding bodies.
The ranking data is also directly relevant to utility companies. Areas assessed such as energy and the environment, digital infrastructure, and mobility are directly factored into each city’s level of development. In turn, the city’s level of development reflects the extent to which local utility providers have driven the transformation. The ranking data also highlights which topics and markets are gaining momentum and where there are opportunities to improve services, investment decisions, and market position.
418 CITIES, ONE DATA FOUNDATION
NINE YEARS, ONE METHODOLOGY
As we have been collecting data using the same methodology since 2018, it is possible not only to assess the current status of a city, but also to track the development of each city and of Germany as a whole over the past decade.
418 CITIES AT A GLANCE
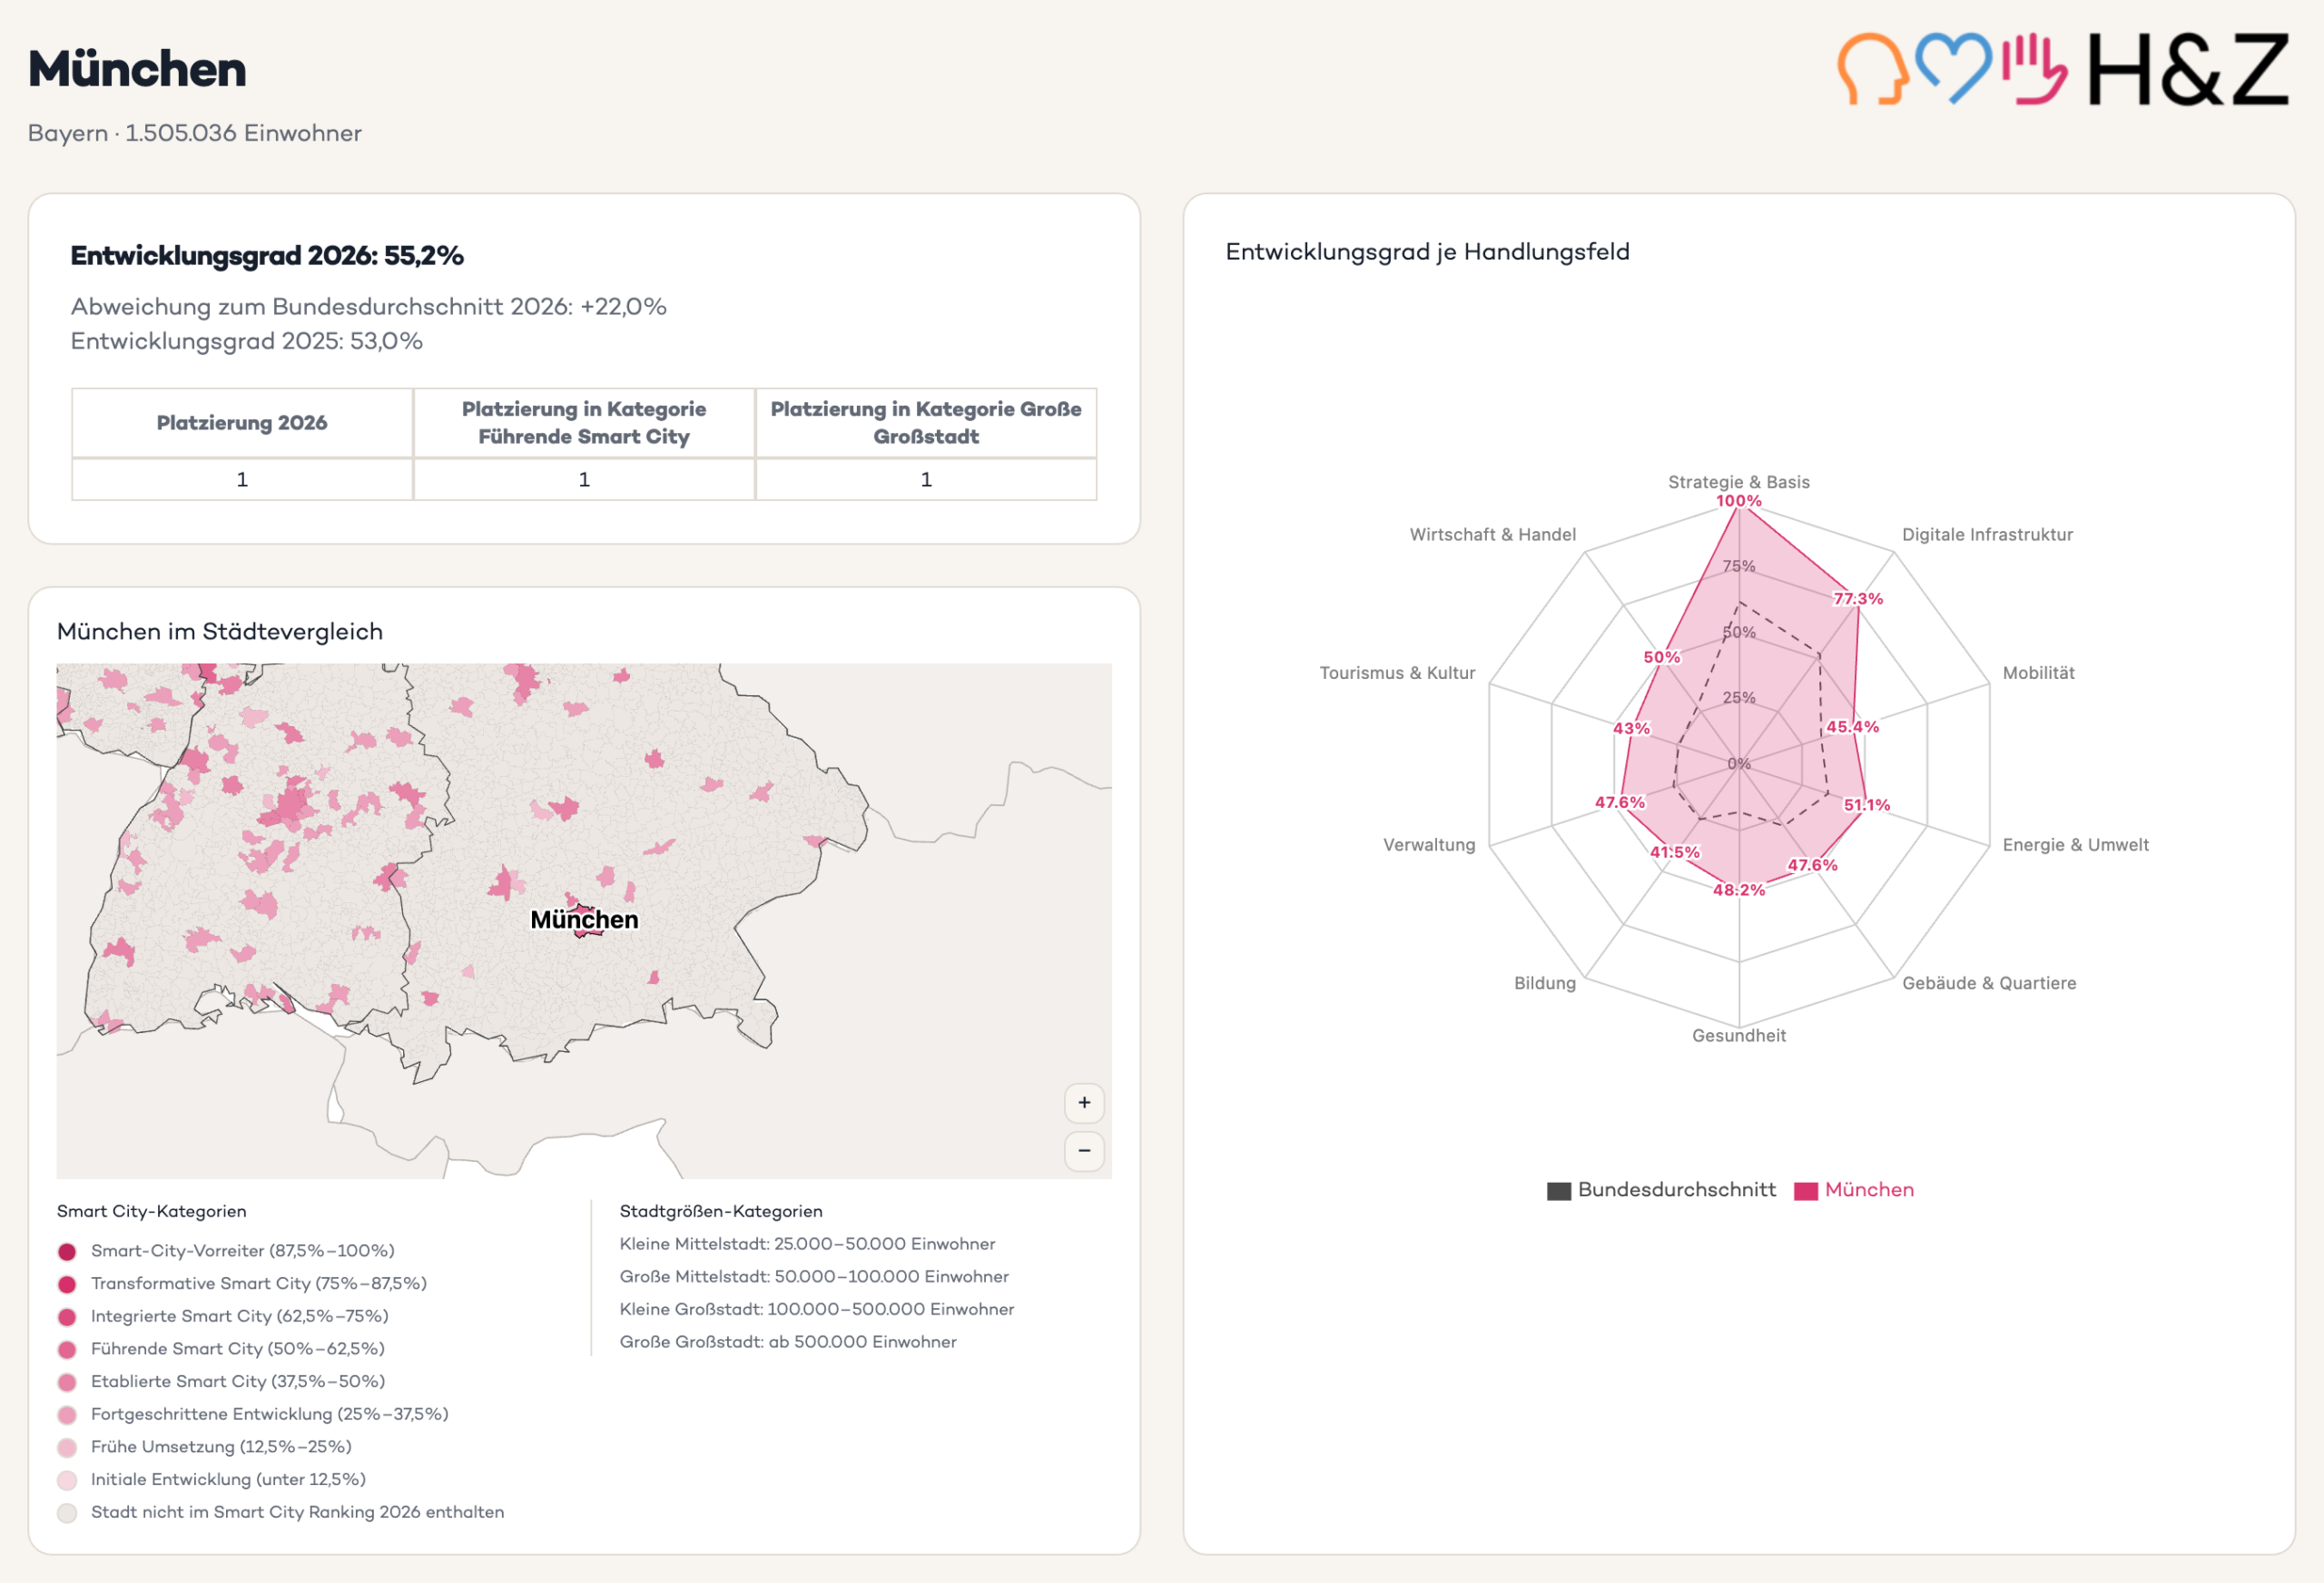
How are German cities faring in their digital transformation? The interactive map shows the results, trends, and rankings for all 418 municipalities analysed.
The map does not only show who is out in front. It also reveals where neighbouring municipalities are pulling ahead, in which of the assessed areas a city is falling short of its own potential, and where that creates a concrete need for action.
The results are only available in German.
HOW TO BEST USE THE RANKING DATA
Cities
- Assess current standing in a nationwide comparison
- Prioritise areas for action
- Develop well-founded arguments for funding and investments
Utility companies
- Evaluate position within the market
- Identify potential for growth and further development
- Devise concrete transformation strategies
HOW SMART IS YOUR CITY?
The Haselhorst Smart City Ranking shows how far the transformation of your city has progressed, based on data and presented transparently. To this end, we collect over 33,000 qualitative and quantitative data points annually from more than 400 German cities.
We look forward to addressing any queries together: from developments since 2018 and particular strengths to areas of potential and possible courses of action. If you are interested, please do get in touch.

DETERMINING THE LEVEL OF DEVELOPMENT
The assessment is carried out in three stages and is based on more than 33,000 data records per year, drawn exclusively from publicly available sources. Select a stage to open what lies behind it.
Potential
Measures a city’s capacity for development on its path to becoming a smart city. It is based on an analysis of around 60 indicators drawn from publicly available data and statistics.
Level of implementation
A qualitative analysis of current strategies and projects based on city websites, official documents, and media reports. This reveals which cities are realising their full potential.
Level of development
The potential identified and the level of implementation are used to derive a score for each city, the level of development. It is comparable across all cities and over a nine-year period.
Around 60 indicators drawn from publicly available data and statistics. They describe the starting position of a city rather than its smart city performance, which is why they are not identical to the ten areas assessed in the second stage.
- Accommodation establishments open
- Airport accessibility
- Airports
- Average age
- Average length of stay
- Beds available
- Business registrations
- Car sharing
- Chief digital officer, smart city manager, or smart city team
- City population
- Completion of new residential buildings
- Corporate insolvency proceedings
- Corporate receivables
- Cycling infrastructure plan
- Debt ratio
- E-scooter sharing
- Electric mobility
- Employees in manufacturing
- Employees in the public and service sectors
- Employees in trade, transport, hospitality, and ICT
- Employees with a university degree
- Fibre rollout FTTB and FTTH
- Forecast demand for new housing
- Forecast growth of the over-80s
- Forecast residents aged 60 to 80
- Forecast residents aged over 80
- Gross domestic product
- Guest arrivals
- Hospital bed density
- Hospitals
- Inland ports
- Investment per employee
- Large companies
- Libraries
- Municipal fiscal capacity
- Municipal utility revenue
- Near-natural areas
- Nitrogen surplus
- Online health advice
- Overnight stays
- Photovoltaics
- Population change over nine years
- Population change over three years
- Population density
- Pupils at general education schools
- Pupils at vocational schools
- Recyclable materials
- Renewable energy
- Renewable heating
- Seaports
- Settlement and transport area
- Smart parking
- Smart schools
- Students at universities
- Students at universities of applied sciences
- Trade tax revenue
- Unemployment rate
- Vehicle density
- Voter turnout
- Wind energy
Across ten areas we examine what a city actually delivers: strategies, projects under way, and published results.
Is there an adopted digital or smart city strategy, with a target vision, clear responsibilities, and funding?
Fibre roll-out (FTTB/H) according to the Federal Gigabit Office.
Connected public transport, sharing services, charging infrastructure, and digital parking and traffic management.
Renewable generation, heat planning, smart grids, and environmental and climate monitoring.
Digitally planned and sustainable neighbourhoods, and building automation across municipal stock.
Digital care services, telemedicine, and emergency and nursing infrastructure.
Digital equipment and connectivity across schools, adult education centres, and libraries, as well as digital participation.
Services available online, digital citizen participation, internal processes, and specialist procedures.
Digital visitor information, visitor management, and cultural and leisure services online.
Support for start-ups and innovation, digital trading platforms, and revitalising the city centre.
A profile emerges for every municipality: level of development, deviation from the national average, ranking within its size category, and the result for each area assessed against the national average.
TALK TO OUR EXPERTS
With head, heart, and hand for your next decision.